Review will be Sunday 11 Dec. in Scovel 116 at 9pm. Here is the review topics. Kit here is the Final Exam.
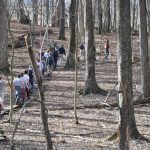
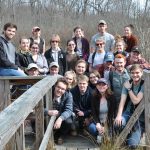
The 2011 Climate change class set out on an epic adventure to reconstruct the climate of the College of Wooster Campus. To take a closer look at the local climate 12 of the majestic oak trees were cored. After intense debate, with no help from our resident biologist or his geology and political science counterparts, the trees were determined to be white oak.
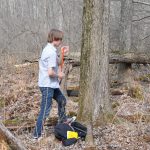
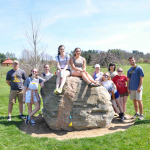
One team of corers, from left to right Stephen Perrott ‘13, Andy Nash ’14, and Ned Weakland ’12.
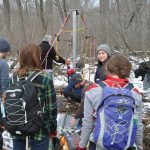
Two or three cores were taken from each tree 180 degrees apart using a 5 mm increment borer. The samples were taken at breast height. All cores were sealed into straws and transported back to the lab. A measurement of both the diameter of the trees and the height to the place the core was taken.
The cores were taken with a 5 mm increment borer. The tree core is then sealed into a straw. A GPS coordinate was taken for each tree. The diameter and height the core was take at was measured. All measurements and GPS points were recorded in ourfield books.
A map generated by Google Earth of the white oak trees that were sampled on campus.
Once back in the lab the cores were mounted and allowed to dry for 24 hours. The cores were then sanded to perfection and the width of each ring measured. The ring width measurements were then correlated together into a master chronology using the program COFECHA.
In the lab the cores were mounted, sanded and measured.
The master chronology was then standardized using the program ARSTAN and the Freidman Super Smoother with a flexibility of 5. The standardized chronology was then correlated with the local meteorological data, temperature and precipitation. The trees showed a strong negative correlation with temperature data and a strong positive correlation with precipitation data. The local precipitation for the months of May, June, and July were then reconstructed using 6 northeastern Ohio tree ring chronologies.
The Google Earth Map shows six tree ring chronologies across northeastern Ohio used to reconstruct climate data by correlating the chronologies against the closest meteorological data from the OARDC.
During precipitation reconstruction, we used six tree ring chronologies. The location, range, and the number of each of the six series from the master chronology are located in this figure.
A graph showing the explosive growth that the campus trees experienced upon the establishment of The College of Wooster in 1866. This was due to the thinning of the stand reducing the amount of competition between the trees for resources. The College of Wooster also maintains the trees improving their growth.
The standardization of the tree rings using the Friedman Super Smoother with a flexibility of 5 eliminates the signal of the establishment of The College of Wooster and allows for the reconstruction of the local climate using meteorological data from the OARDC.
Observed May, June, and July precipitation in comparison with the tree ring reconstruction. The relationship between these to systems correlate with an r value of 0.56.
The tree ring based reconstuction correlated with the meterological data for Northeastern Ohio.
r = 0.56
We would like to thank the contributors to this project, Beau Mastrine for granting us permission to sample the campus trees and Dr. Wiles for his input.


